Internet of things Device Dashboard
A software system for displaying IoT device data in real-time.
TL;DR
I built and designed a system for collecting, storing, and viewing sensor data collected by IoT devices (such as an Arduino). The system utilizes an MQTT broker, Telegraf, InfluxDB, Grafana, and Docker Compose. The system is hosted on my server using Nginx to reverse proxy for various deployments. This project was used in a Senior Capstone project at the University of Colorado Boulder. The repository for the project can be found here.
Summary
This project was done in collaboration with one of my college roommates for his Senior Capstone in Aerospace at the University of Colorado Boulder. The requirements for this project were to create a scalable system for collecting, storing, and viewing data from Internet of Things (IoT) devices. There were budget constraints that prevented the final system from being hosted on AWS or Google Cloud. To make due we decided to host the system on a spare PC in our living room running Ubuntu. The PC hosts various other applications like Minecraft and Valheim servers. The PC uses Nginx to reverse proxy various requests to the several docker containers it is running. The primary components of the system are an MQTT Broker, Telegraf, InfluxDB, and Grafana.
If you are unfamiliar with MQTT it was a protocol invented in 1999 by Andy Stanford-Clark and Arlen Nipper. Stanford-Clark and Nipper “needed a protocol for minimal battery loss and minimal bandwidth to connect with oil pipelines via satellite” Source. However, the primary focus of MQTT has now shifted “from proprietary embedded systems to open [IoT] use cases” Source.
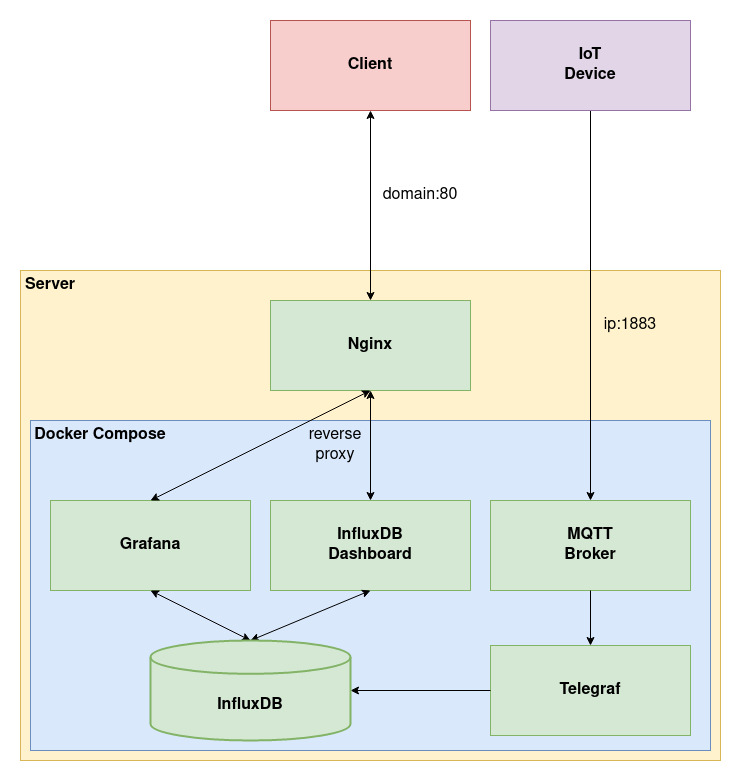
MQTT works on a publish/subscribe system. The IoT devices publish timestamped data to the MQTT broker via specified directories, for example, /sensors/data/. Telegraf is used to retrieve the data from the MQTT broker and store it in the InfluxDB database. The Telegraf instance subscribes to the /sensors/data/ directory and receives all data published to it. This system works well for IoT devices because it allows you to scale the number of devices without having to tell them about the subscribers that need to receive the data. If a new subscriber is added to the system the code on the IoT devices need not change as the new subscriber will just tell the MQTT broker which data it wants.
The client can access the Grafana dashboard and view the data being published by the IoT devices. A domain name was created for the dashboard and Nginx listens on port 80 for the domain, the requests are reversed proxy-ed to the InfluxDB container. The MQTT Broker being a stream was not assigned a domain, also it is not to be accessed by anyone other than the IoT devices. The MQTT broker listens on port 1883. The MQTT broker is password protected so that only devices with authentication can publish and subscribe. Below is the architecture diagram for the project.
